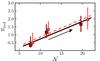
Fig. 9
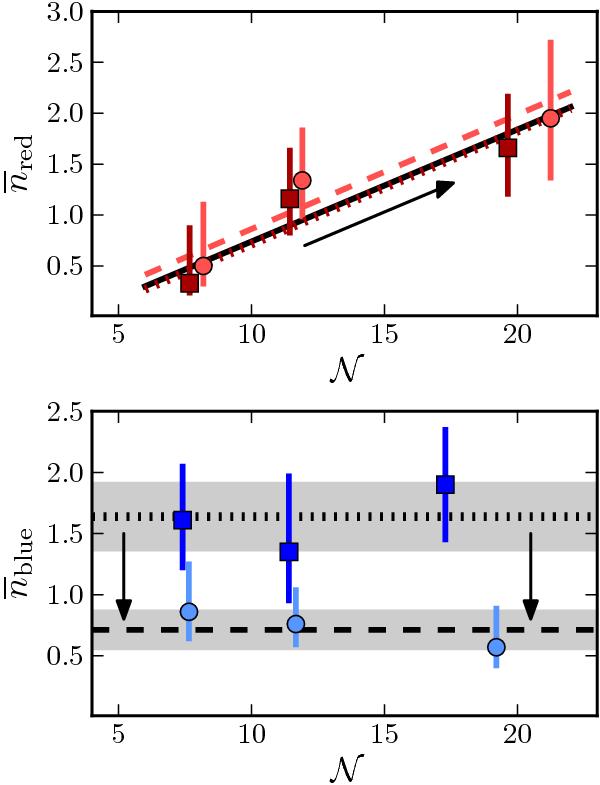
Number of neighbours per principal galaxy as a function of group richness  and redshift. Top:
  at 0.2 ≤ z < 0.65 (dots) and at 0.65 ≤ z < 0.95 (squares). The dashed and dotted lines are the best error-weighted least-squares linear fit to the data at the lower and higher redshift bins. The solid line is the global relation for red principals in Fig. 8, and the arrow marks the redshift evolution of the relation. Bottom:
  at 0.2 ≤ z < 0.81 (dots) and at 0.81 ≤ z < 0.95 (squares). The dashed and dotted lines are the error-weighted average number of neighbours at the lower and higher redshift bins, with the grey areas showing the uncertainty in these averages. The arrows mark the redshift evolution of the relation.
Current usage metrics show cumulative count of Article Views (full-text article views including HTML views, PDF and ePub downloads, according to the available data) and Abstracts Views on Vision4Press platform.
Data correspond to usage on the plateform after 2015. The current usage metrics is available 48-96 hours after online publication and is updated daily on week days.
Initial download of the metrics may take a while.