Fig. 8
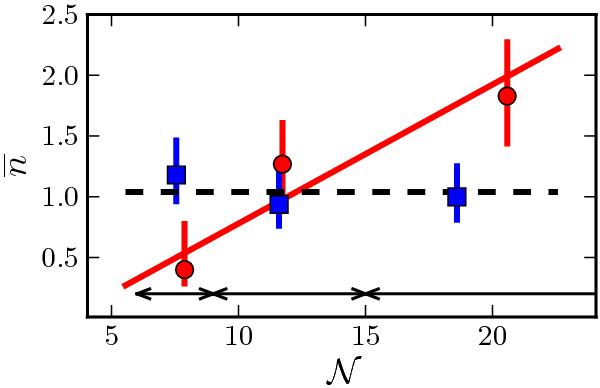
Number of close neighbours per principal galaxy as a function of group richness  . Dots and squares refer to red, passive and blue, star-forming principal galaxies, respectively. The solid line is the best error-weighted least-squares linear fit to the red principal galaxies data. The dashed line is the average number of close neighbours per blue galaxy if it is assumed independent of . The arrows mark the three ranges of richness probed.
Current usage metrics show cumulative count of Article Views (full-text article views including HTML views, PDF and ePub downloads, according to the available data) and Abstracts Views on Vision4Press platform.
Data correspond to usage on the plateform after 2015. The current usage metrics is available 48-96 hours after online publication and is updated daily on week days.
Initial download of the metrics may take a while.