Free Access
Fig. 2
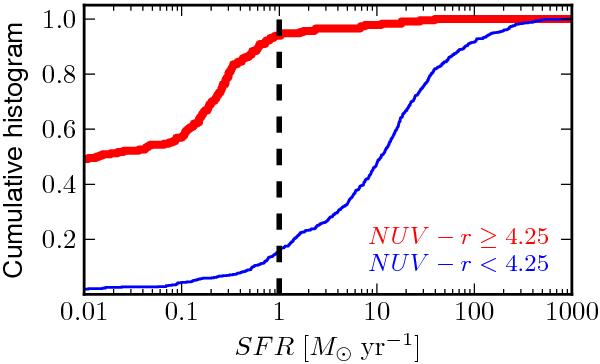
Cumulative histogram of red (thick line) and blue (thin line) principal galaxies as a function of their star formation rate. The definition of red and blue galaxy is labelled in the figure. The vertical dashed line marks SFR = 1 M⊙ yr-1.
Current usage metrics show cumulative count of Article Views (full-text article views including HTML views, PDF and ePub downloads, according to the available data) and Abstracts Views on Vision4Press platform.
Data correspond to usage on the plateform after 2015. The current usage metrics is available 48-96 hours after online publication and is updated daily on week days.
Initial download of the metrics may take a while.