Fig. 10
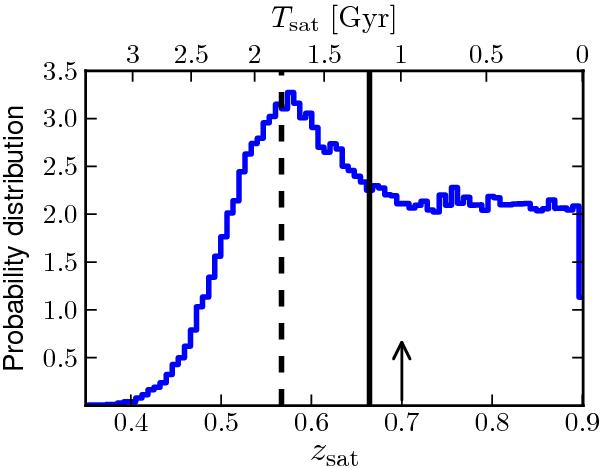
Probability distribution of zsat, the redshift at which a blue principal galaxy at z = 0.9 becomes a satellite. The upper x-axis shows the cosmological time spanned since z = 0.9. The solid vertical line shows the redshift at which half of the initial sources have become a satellite. The dashed line marks TQ = 1.8 Gyr after z = 0.9. The arrow marks the redshift at which we estimate the infall rate.
Current usage metrics show cumulative count of Article Views (full-text article views including HTML views, PDF and ePub downloads, according to the available data) and Abstracts Views on Vision4Press platform.
Data correspond to usage on the plateform after 2015. The current usage metrics is available 48-96 hours after online publication and is updated daily on week days.
Initial download of the metrics may take a while.