Fig. 4
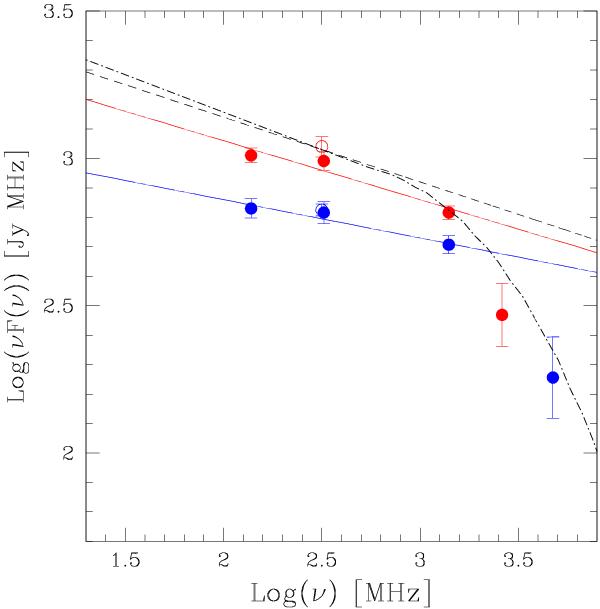
Spectrum of the radio halo extracted within an aperture of 17.5′ (red, 0.37 R500) and 13′ (blue, 0.27 R500). The high-frequency points are corrected for the SZ-decrement measured on the same scales. For comparison the empty symbols mark fluxes measured in the same aperture radius using the Brown & Rudnick (2011) data. Best fits to the low-frequency data are reported as solid lines (same color-code), while the best fit to the T03 compilation (dashed line) and the synchrotron model with the cut-off of Fig. 1 (dot-dashed line) are reported for comparison.
Current usage metrics show cumulative count of Article Views (full-text article views including HTML views, PDF and ePub downloads, according to the available data) and Abstracts Views on Vision4Press platform.
Data correspond to usage on the plateform after 2015. The current usage metrics is available 48-96 hours after online publication and is updated daily on week days.
Initial download of the metrics may take a while.