Fig. 2
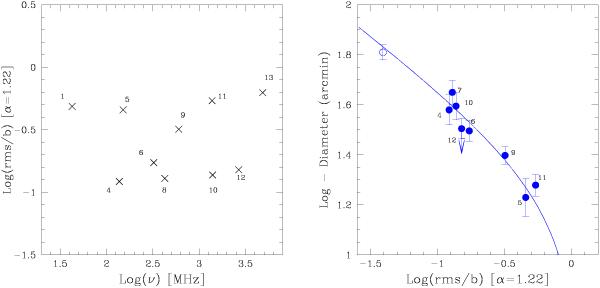
Left: sensitivity to diffuse emission of the observations at different frequencies (rms/beam, scaled to 0.3 GHz with α = 1.22, using an arbitrary scale). Right: radio halo diameters measured from radio maps (using 3σ contours) vs. sensitivity of the observations; for comparison, the empty symbol marks data from the Brown & Rudnick (2011) WSRT observation at 330 MHz. For the Effelsberg data-point at 2.675 GHz (12) we used an upper limit because the size of the halo measured from the contours of the image by T03 is biased high by discrete sources embedded in the halo.
Current usage metrics show cumulative count of Article Views (full-text article views including HTML views, PDF and ePub downloads, according to the available data) and Abstracts Views on Vision4Press platform.
Data correspond to usage on the plateform after 2015. The current usage metrics is available 48-96 hours after online publication and is updated daily on week days.
Initial download of the metrics may take a while.