Fig. 1
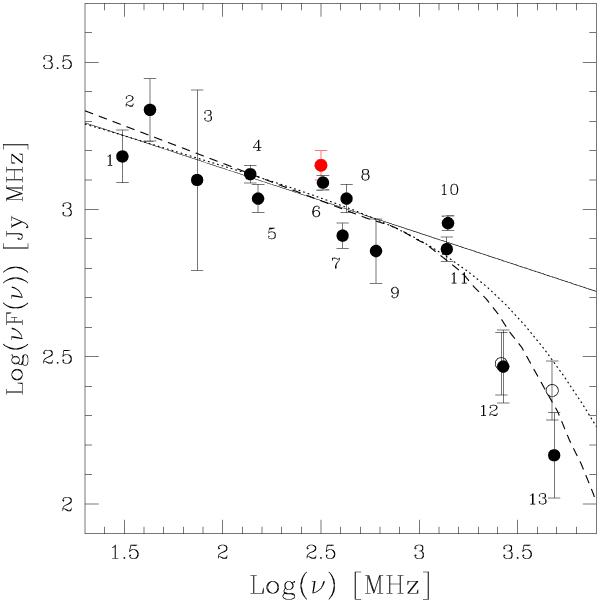
Observed spectrum of the Coma radio halo (black data-points) and the power law (α = 1.22 ± 0.04) that best fits the spectrum at lower frequencies, ν ≤ 1.4 GHz (solid line). Empty points are the data with the SZ correction added, the SZ-decrement is calculated from Planck measurements by adopting an aperture radius =0.48 R500. The dotted line is a synchrotron model assuming a broken power-law energy distribution of the emitting electrons, N(E) ∝ E− δ and ∝ E− (δ + Δδ), at lower and higher energies, with δ = 2.4 and Δδ = 1.6. The dashed line is a synchrotron model assuming a power-law (δ = 2.5) with a high energy cut-off, which occurs for instance in (homogeneous) reacceleration models (see e.g. Schlickeiser et al. 1987). The red point is the flux measured in the high-sensitivity observations at 330 MHz by Brown & Rudnick (2011) within an aperture radius =0.48 R500.
Current usage metrics show cumulative count of Article Views (full-text article views including HTML views, PDF and ePub downloads, according to the available data) and Abstracts Views on Vision4Press platform.
Data correspond to usage on the plateform after 2015. The current usage metrics is available 48-96 hours after online publication and is updated daily on week days.
Initial download of the metrics may take a while.