Fig. A.4
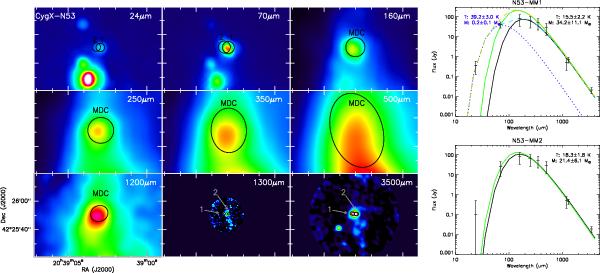
Left: results of the source extraction by getsources in CygX-N53. The emission from the MDC is then divided by 2 fragments. Right: SED of CygX-N53 MM1 and MM2. Curves are the same as in Fig. A.1. The extraction from getsources assigned a significant flux to MM2 at 70 μm even though this emission is mostly centred on MM1. Therefore, we believe that the 70 μm flux measurement is slightly overestimated for MM2. For MM1 we can see that a temperature of 20 K (green curves), as assumed by Bontemps et al. (2010), greatly overestimates the emission around the peak of the SED.
Current usage metrics show cumulative count of Article Views (full-text article views including HTML views, PDF and ePub downloads, according to the available data) and Abstracts Views on Vision4Press platform.
Data correspond to usage on the plateform after 2015. The current usage metrics is available 48-96 hours after online publication and is updated daily on week days.
Initial download of the metrics may take a while.