Fig. A.3

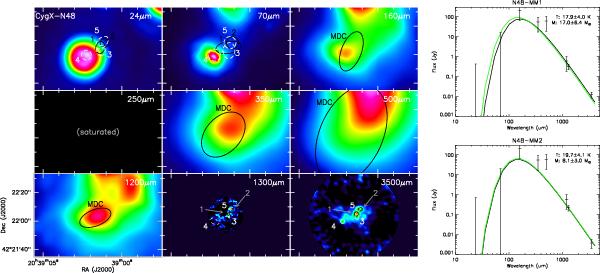
Left: results of the source extraction by getsources in CygX-N48. The 250 μm image is unusable since it is saturated. In this case, because the 24 μm emission does not trace the millimetre sources, we have used the combined detections at 350 μm and 1.2 mm for estimating the emission from the MDC, whose flux is then divided by 5 fragments. The flux extraction at 500 μm is not very well constrained to the MDC only, and therefore the flux measurement at 500 μm is likely overestimated. Right: SEDs of CygX-N48 MM1 (top) and MM2 (bottom). Curves are the same as in Fig. A.1.
Current usage metrics show cumulative count of Article Views (full-text article views including HTML views, PDF and ePub downloads, according to the available data) and Abstracts Views on Vision4Press platform.
Data correspond to usage on the plateform after 2015. The current usage metrics is available 48-96 hours after online publication and is updated daily on week days.
Initial download of the metrics may take a while.


