Fig. A.1
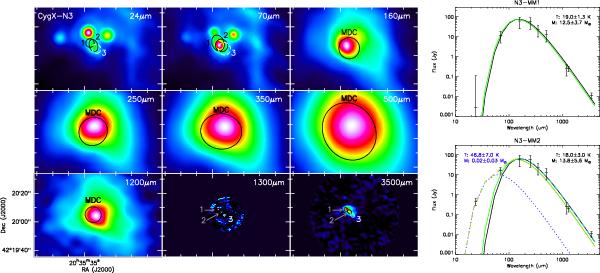
Left: results of the source extraction by getsources in CygX-N3. All images cover the same angular scale. The detections of getsources at 1.3 mm are used to extract the fluxes at 24 μm, 70 μm, 1.3 mm, and 3.5 mm (even though we study only sources 1 and 2, in black). The getsources detections at 24 μm are used to retrieve the flux of the MDC in the remaining bands (MDC shown in black). These MDC fluxes are divided by the 3 fragments detected at 1.3 mm. Right: SEDs of CygX-N3 MM1 (top) and MM2 (bottom). The black curves (and top-right parameters) are the grey-body fits to the cold component. The green line shows the grey-body curve of the cold component assuming fixed parameters (from Bontemps et al. 2010). When applicable, the best SED fit of a warm component is shown as a dotted blue curve and top-left parameters. The sum of the cold and warm components is plotted with dashed lines (light blue for the sum of best SED fit, and yellow for the sum of the warm component with the fixed-parameters SED).
Current usage metrics show cumulative count of Article Views (full-text article views including HTML views, PDF and ePub downloads, according to the available data) and Abstracts Views on Vision4Press platform.
Data correspond to usage on the plateform after 2015. The current usage metrics is available 48-96 hours after online publication and is updated daily on week days.
Initial download of the metrics may take a while.