Fig. 4
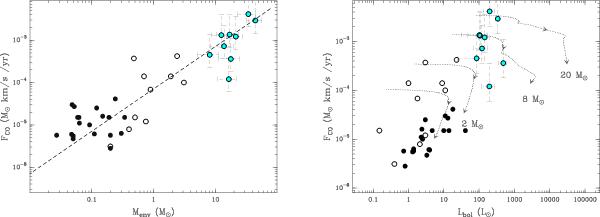
Outflow momentum flux correlation with envelope mass (left) and with bolometric luminosity (right). The black filled and open circles are the low-mass Class I and Class 0 sources from Bontemps et al. (1996). The light blue circles are the massive protostars from our sample. In the left panel, the black dashed line is the observational linear relation found by Bontemps et al. (1996), showing that it also holds for the massive individual protostars. On the right, we show the evolutionary tracks corresponding to those of Fig. 1.
Current usage metrics show cumulative count of Article Views (full-text article views including HTML views, PDF and ePub downloads, according to the available data) and Abstracts Views on Vision4Press platform.
Data correspond to usage on the plateform after 2015. The current usage metrics is available 48-96 hours after online publication and is updated daily on week days.
Initial download of the metrics may take a while.