Fig. 3
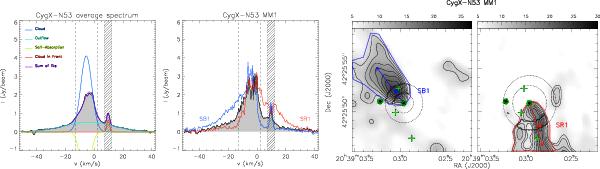
Left: average 12CO (2–1) spectrum in CygX-N53. The Gaussian fits made to the data are shown with curves in different colours: ambient cloud in dark blue, broad outflow emission in light blue, self-absorption in olive-green, emission from another cloud in red, and final model spectra in purple. The vertical dashed lines constrain the systemic velocities of the cloud excluded for the momentum flux calculations. The shadowed area shows the velocity range affected by a cloud in front, also excluded for momentum flux estimates. Centre: 12CO (2–1) spectra at the position of CygX-N53 MM1 in grey, with the spectra at the peak of the blue and red emission (SB1 and SR1 positions marked as blue and red crosses on the right panels). Right: example of the areas used for measuring the CO outflow momentum flux for CygX-N53 MM1, with the blue and red CO emission in grey scale and contours. The intersection between the polygons and rings are the areas taken to measure the respective momentum flux for each wing.

Current usage metrics show cumulative count of Article Views (full-text article views including HTML views, PDF and ePub downloads, according to the available data) and Abstracts Views on Vision4Press platform.
Data correspond to usage on the plateform after 2015. The current usage metrics is available 48-96 hours after online publication and is updated daily on week days.
Initial download of the metrics may take a while.