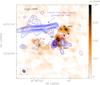
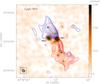
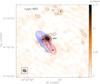
Fig. 2
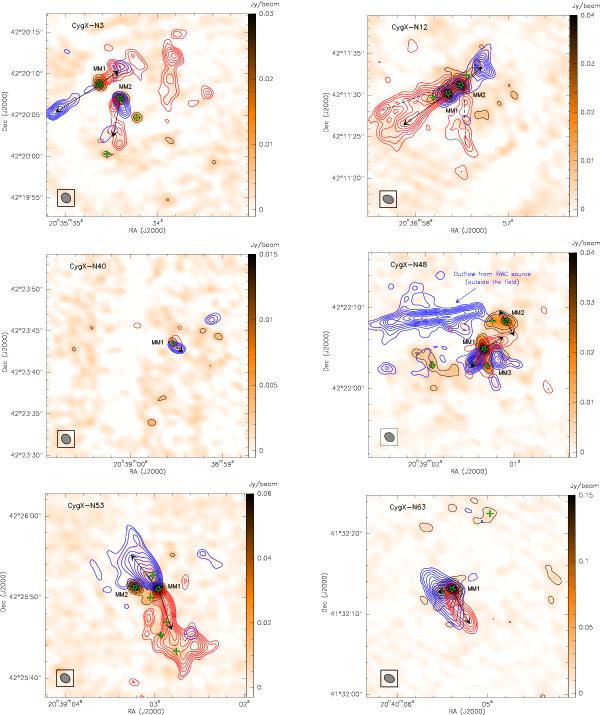
PdBI 1.2 mm continuum emission in colour scale, overplotted with the blue and red contours from the CO emission of N3 (top-left), N12 (top-right), N40 (middle-left), N48 (middle-right), N53 (bottom-left), N63 (bottom-right). The beam sizes are represented in the lower-left corner of each panel. The 9 high-mass cores identified in Bontemps et al. (2010) are marked as green stars, and the possible low mass fragments identified are marked as green crosses. The sources discussed here are labelled. The arrows show the directions of the outflows identified in this paper, for which we estimated the energetics.
Current usage metrics show cumulative count of Article Views (full-text article views including HTML views, PDF and ePub downloads, according to the available data) and Abstracts Views on Vision4Press platform.
Data correspond to usage on the plateform after 2015. The current usage metrics is available 48-96 hours after online publication and is updated daily on week days.
Initial download of the metrics may take a while.