Fig. B.1
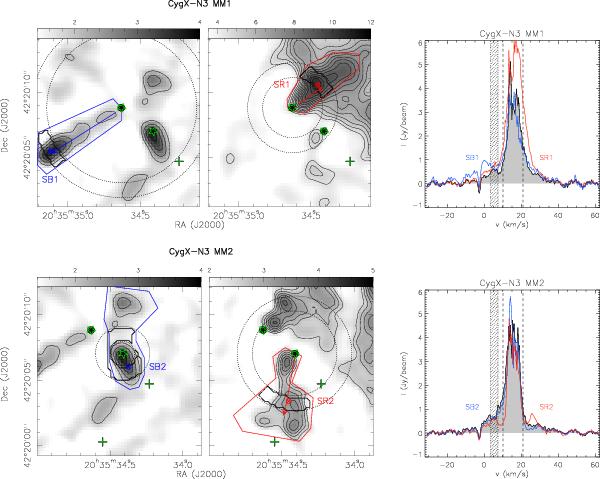
Left: blue and red CO emission in grey scale and contours for CygX-N3 MM1 (top) and MM2 (bottom). For clarity purposes only, the shown integrated intensity for MM2 red emission covers a narrower velocity range than used for the actual estimation. The intersection between the polygons and rings are the areas taken to measure the respective momentum flux for each wing. The blue and red crosses show the positions of the spectra shown on the right panel. Right: spectra at the position of the source in grey (CygX-N3 MM1 in the top panel and MM2 in the lower), with the spectra at the peak of the blue and red emission (SB1 and SR1 for MM1, SB2 and SR2 for MM2). The vertical dashed lines constrain the systemic velocities of the cloud excluded for the momentum flux calculations. The shaded area shows the velocity range affected by a cloud in front, also excluded.

Current usage metrics show cumulative count of Article Views (full-text article views including HTML views, PDF and ePub downloads, according to the available data) and Abstracts Views on Vision4Press platform.
Data correspond to usage on the plateform after 2015. The current usage metrics is available 48-96 hours after online publication and is updated daily on week days.
Initial download of the metrics may take a while.