Fig. 1
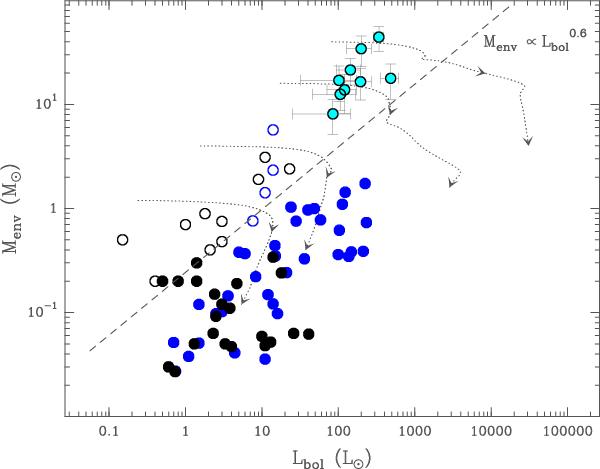
Envelope/core mass with respect to the bolometric luminosity. For the massive
protostars studied here, in light blue circles, the values are as estimated from the
SED fittings (see Sect. 4.1 and Appendix A for more details). The remaining filled and
empty symbols are the low-mass Class I and Class 0 objects, respectively (from Bontemps et al. 1996 in black; and from Motte & André 2001; and André et al. 2000, in dark blue). The dotted curves show four
examples of evolutionary tracks with decreasing accretion rates, for envelopes with
initial masses of 0.6, 2, 8, and 20 M⊙ (see Sect. 6). The arrows show the positions in each track
where 50% and 90% of the envelope mass has been accreted onto the protostar. The
dashed line represents the  relation. The placement of the curve
at
relation. The placement of the curve
at  comes as an empirical border line
between Class 0 and Class I evolutionary stages.
comes as an empirical border line
between Class 0 and Class I evolutionary stages.
Current usage metrics show cumulative count of Article Views (full-text article views including HTML views, PDF and ePub downloads, according to the available data) and Abstracts Views on Vision4Press platform.
Data correspond to usage on the plateform after 2015. The current usage metrics is available 48-96 hours after online publication and is updated daily on week days.
Initial download of the metrics may take a while.