Free Access
Fig. 8
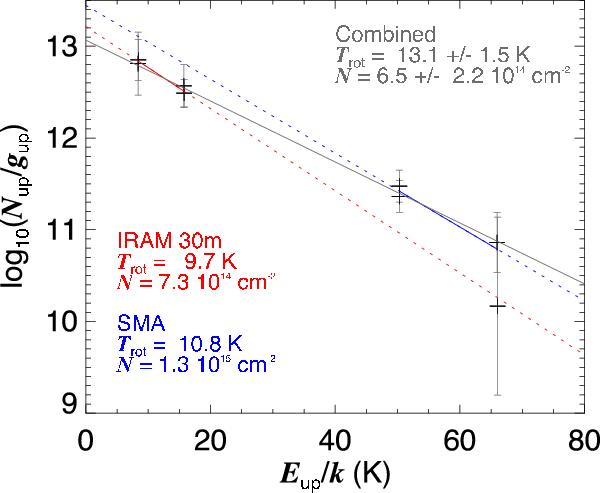
Rotational temperature diagram for PO  emission measured in the IRAM 30 m and SMA data. The error bars represent 1σ uncertainties in the data. The red and blue fits only take into account the IRAM 30 m or the SMA data, respectively, while the grey fit combines these.
Current usage metrics show cumulative count of Article Views (full-text article views including HTML views, PDF and ePub downloads, according to the available data) and Abstracts Views on Vision4Press platform.
Data correspond to usage on the plateform after 2015. The current usage metrics is available 48-96 hours after online publication and is updated daily on week days.
Initial download of the metrics may take a while.