Free Access
Fig. 3
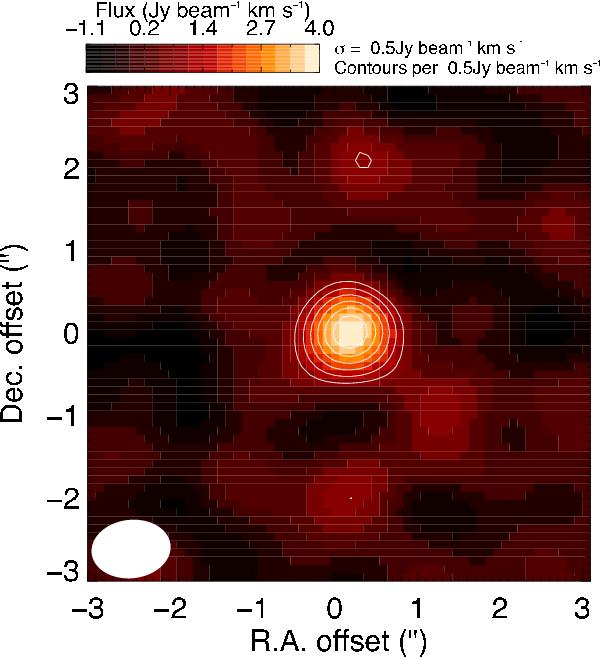
Moment-zero map of the PN J = 6 − 5 transition. The emission was integrated over the velocity range [νLSR − 22,νLSR + 20] km s-1. Contours start at 2σ (1.0 Jy beam-1 km s-1), with 1σ increments. The synthesised beam FWHM is represented by the filled ellipse in the bottom left corner.
Current usage metrics show cumulative count of Article Views (full-text article views including HTML views, PDF and ePub downloads, according to the available data) and Abstracts Views on Vision4Press platform.
Data correspond to usage on the plateform after 2015. The current usage metrics is available 48-96 hours after online publication and is updated daily on week days.
Initial download of the metrics may take a while.