Fig. 2
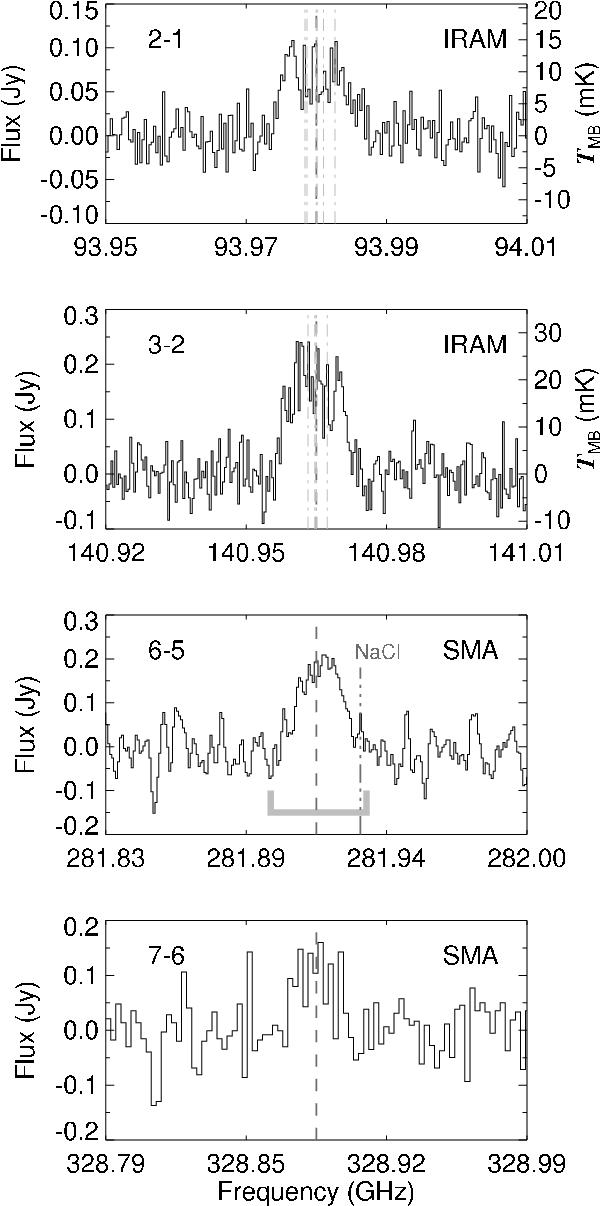
PN emission from the CSE of IK Tau. Upper two panels:IRAM 30 m data, lower two panels: SMA survey data. The vertical dashed lines indicate the rest frequency of the respective rotational transition. For J = 2 − 1 and 3–2 we also indicate the position of the HFS components with dash-dotted lines. For J = 6 − 5 we indicate the rest frequency of NaCl ν= 2,J = 22 − 21, and the range over which was integrated to obtain the moment-zero map in Fig. 3.
Current usage metrics show cumulative count of Article Views (full-text article views including HTML views, PDF and ePub downloads, according to the available data) and Abstracts Views on Vision4Press platform.
Data correspond to usage on the plateform after 2015. The current usage metrics is available 48-96 hours after online publication and is updated daily on week days.
Initial download of the metrics may take a while.