Free Access
Fig. 1
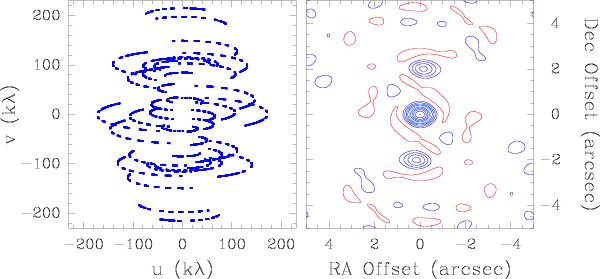
Coverage of the uv-plane (left) and shape of the synthesised beam (right) in the SMA survey of IK Tau, at 281.91 GHz. The contours in the right panel are at 10% spacings and start at the 10% level. The 50% contour is in green, all other positive contours are blue. The negative contours, marked in red, are at − 10%.
Current usage metrics show cumulative count of Article Views (full-text article views including HTML views, PDF and ePub downloads, according to the available data) and Abstracts Views on Vision4Press platform.
Data correspond to usage on the plateform after 2015. The current usage metrics is available 48-96 hours after online publication and is updated daily on week days.
Initial download of the metrics may take a while.