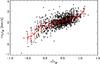
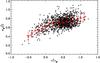
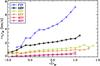
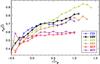
Fig. 8

Correlations between granule brightness and other granule properties. Left panels: correlation between granule brightness, ⟨Î⟩gr, and average vertical velocity. Right panels: correlation between ⟨Î⟩gr and standard deviation of normalised intensity σgr(Î) as measure for the substructure within the granules. The upper panels show scatter plots for the solar run (G2V) where each black diamond represents a single granule. The red diamonds are binned averages (bin size 0.1 in Î) the error bars show the 1-σ scatter. In the lower panels the binned data are displayed for each of the six simulations.
Current usage metrics show cumulative count of Article Views (full-text article views including HTML views, PDF and ePub downloads, according to the available data) and Abstracts Views on Vision4Press platform.
Data correspond to usage on the plateform after 2015. The current usage metrics is available 48-96 hours after online publication and is updated daily on week days.
Initial download of the metrics may take a while.