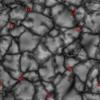
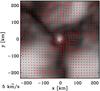
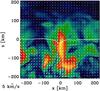
Fig. 4

Vertical vortices. Left panel: intensity map with bright points (Î > 1.0) in a snapshot of the K5V simulation, all of which are associated with vertical vortices. Middle panel: zoom into the intensity map of a vertical vortex; the horizontal flow at z = 0 is shown as red arrows. Right panel: vertical cut through the vortex shown in the middle panel; the colour map shows the modulus of the vorticity | ω| = |∇ × υ | (red/yellow indicating regions of high vorticity), the white arrows show the projection of the velocity onto the plane of the cut, the solid white line indicates the optical surface (τR = 1).
Current usage metrics show cumulative count of Article Views (full-text article views including HTML views, PDF and ePub downloads, according to the available data) and Abstracts Views on Vision4Press platform.
Data correspond to usage on the plateform after 2015. The current usage metrics is available 48-96 hours after online publication and is updated daily on week days.
Initial download of the metrics may take a while.