Fig. 3
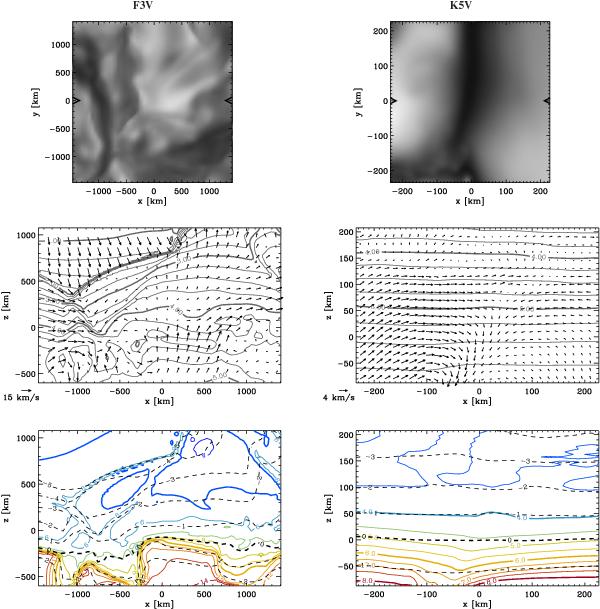
Comparison between F3V and K5V granulation. Top panels: images of the bolometric intensity in small areas of simulation snapshots corresponding to about the size of one granule in the respective simulations. The images are 50 and 58 grid points across, for the F3V and K5V simulations, respectively. The black triangles mark the position y = 0 of the vertical cuts shown in the lower panels. Middle panels: vertical cuts through the near-surface layers; arrows indicate the velocity field, grey contours show the isobars (labels give the logarithm of the pressure in dyn cm-2). Bottom panels: same cuts as middle panels showing the temperature field (coloured solid contours, labels in 1000 K) and levels of constant Rosseland optical depth τR (dashed contours, labels give logarithm of τR).
Current usage metrics show cumulative count of Article Views (full-text article views including HTML views, PDF and ePub downloads, according to the available data) and Abstracts Views on Vision4Press platform.
Data correspond to usage on the plateform after 2015. The current usage metrics is available 48-96 hours after online publication and is updated daily on week days.
Initial download of the metrics may take a while.