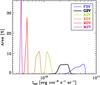
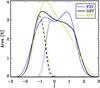
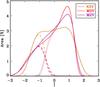
Fig. 2

Intensity histograms. Left panel: histograms of the bolometric intensity. The bins are logarithmically equidistant with a bin size of 0.01 dex. Middle and right panels: histograms of the normalised intensity fluctuation Î (see Eq. (1)). The bins are linearly equidistant with a bin size of 0.1. Solid curves show the histograms of the entire area, dotted and dashed curves show the histograms of granules and intergranular lanes, respectively, as detected by the algorithm described in Sect. 3.1.
Current usage metrics show cumulative count of Article Views (full-text article views including HTML views, PDF and ePub downloads, according to the available data) and Abstracts Views on Vision4Press platform.
Data correspond to usage on the plateform after 2015. The current usage metrics is available 48-96 hours after online publication and is updated daily on week days.
Initial download of the metrics may take a while.