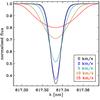
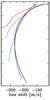
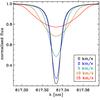
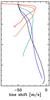
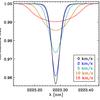
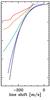
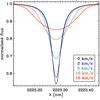
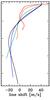
Fig. 19

Rotational broadening and line distortion. Upper panels: rotational broadening of the Fe i line at 617.3 nm for the G2V (left) and M0V (right) simulations. The narrow right subplots of each plot show the bisectors of the lines (same colour code and ordinate labels as other subplot). Lower panels: same as upper panels, but for the Ti i line at 2223 nm. In all cases, we used solar differential rotation together with five different rotation rates.
Current usage metrics show cumulative count of Article Views (full-text article views including HTML views, PDF and ePub downloads, according to the available data) and Abstracts Views on Vision4Press platform.
Data correspond to usage on the plateform after 2015. The current usage metrics is available 48-96 hours after online publication and is updated daily on week days.
Initial download of the metrics may take a while.