Fig. 17
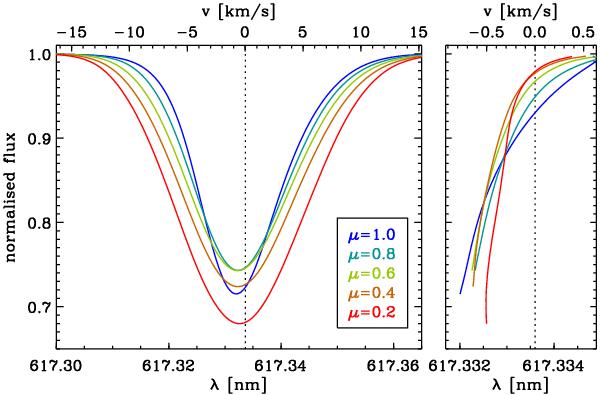
Centre-to-limb variation of a sample line profile. Left panel: line profile obtained from the F3V simulation (Fe i line at 617.3 nm; average over six snapshots) for various values of μ = cosθ. Right panel: bisector variation of the profile; same colour code and ordinate labels as left panel.
Current usage metrics show cumulative count of Article Views (full-text article views including HTML views, PDF and ePub downloads, according to the available data) and Abstracts Views on Vision4Press platform.
Data correspond to usage on the plateform after 2015. The current usage metrics is available 48-96 hours after online publication and is updated daily on week days.
Initial download of the metrics may take a while.