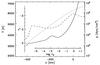
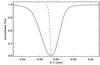
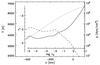
Fig. 16
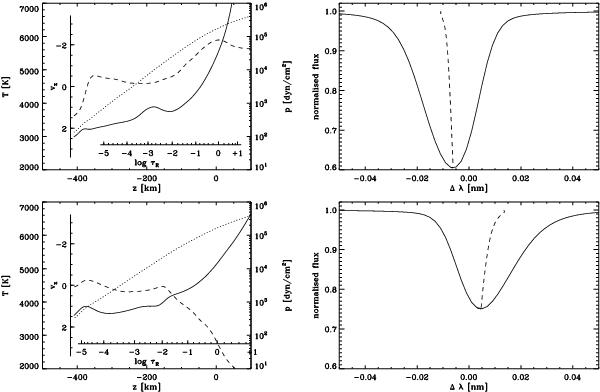
Synthetic line profiles (Ti i at 2223 nm) of single vertical rays of the K0V-star simulation in an upflow region (upper panels) and in a downflow region (lower panels). Left panels: temperature (solid), pressure (dotted), and vertical component of the fluid velocity (dashed) along the vertical ray. Right panels: profiles of the Ti i line at 2223 nm obtained with SPINOR for the corresponding vertical rays (Δλ = λ − λrest; the dashed lines give the bisectors of the profiles).
Current usage metrics show cumulative count of Article Views (full-text article views including HTML views, PDF and ePub downloads, according to the available data) and Abstracts Views on Vision4Press platform.
Data correspond to usage on the plateform after 2015. The current usage metrics is available 48-96 hours after online publication and is updated daily on week days.
Initial download of the metrics may take a while.