Fig. 4
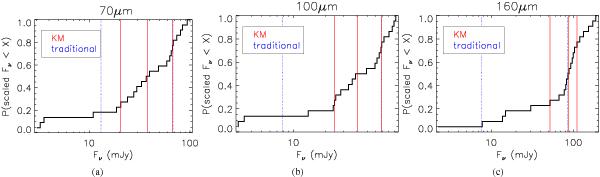
Cumulative distributions of the luminosity scaled flux for PACS photometry of K and M Class II sources modeled in this paper. Distributions are built using the Kaplan-Meier estimator. The median and quartile values are shown with the vertical red lines, and the traditional median and quartiles are shown with the blue lines. The traditional method for determining lower quartiles fails in the situation where more than ~25% of observations result in nondetection, whereas this approach allows the determination of an upper limit to the quartile. The 160 μm median presented here represents an upper limit, as more than half the sources are undetected at this wavelength.
Current usage metrics show cumulative count of Article Views (full-text article views including HTML views, PDF and ePub downloads, according to the available data) and Abstracts Views on Vision4Press platform.
Data correspond to usage on the plateform after 2015. The current usage metrics is available 48-96 hours after online publication and is updated daily on week days.
Initial download of the metrics may take a while.