Fig. 5
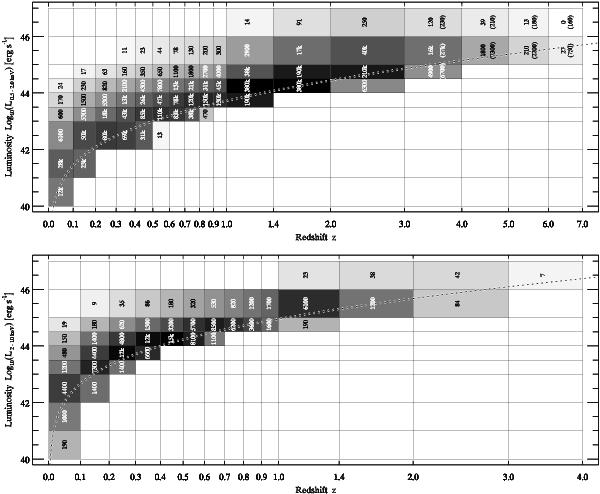
Number of AGN in different redshift and luminosity bins expected to be detected in the course of the four-year survey in the soft (top) and hard (bottom) bands. White empty bins with no number correspond to zero sources. The dotted line corresponds to the detection limit of eRASS. In the soft-band plot, the numbers in brackets are for the XLF without the exponential redshift cutoff, they are given only if the difference exceeds 10%.
Current usage metrics show cumulative count of Article Views (full-text article views including HTML views, PDF and ePub downloads, according to the available data) and Abstracts Views on Vision4Press platform.
Data correspond to usage on the plateform after 2015. The current usage metrics is available 48-96 hours after online publication and is updated daily on week days.
Initial download of the metrics may take a while.