Fig. 10
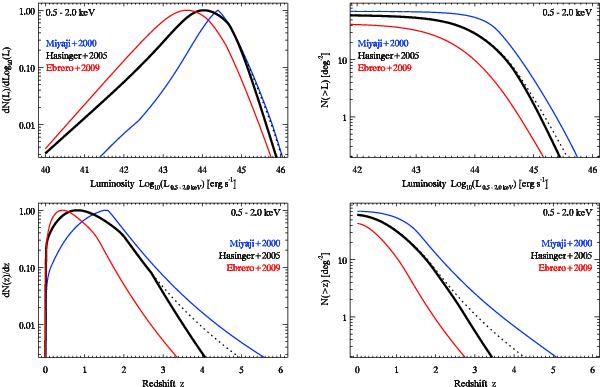
Differential (left) and cumulative (right) luminosity (top) and redshift (bottom) distributions of the soft-band extragalactic sky sample computed using different XLFs. The thick solid black curves show predictions based on the default XLF model. Also shown are predictions for the XLF model of Miyaji et al. (2000, Table 3), Hasinger et al. (2005, Table 5, without the exponential redshift cutoff, dotted curve), and Ebrero et al. (2009). To facilitate the comparison of shapes, differential distributions in left panels are normalized to unity.
Current usage metrics show cumulative count of Article Views (full-text article views including HTML views, PDF and ePub downloads, according to the available data) and Abstracts Views on Vision4Press platform.
Data correspond to usage on the plateform after 2015. The current usage metrics is available 48-96 hours after online publication and is updated daily on week days.
Initial download of the metrics may take a while.