Fig. 9

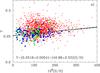
a)Y – O/H for the sample of 1610 H ii
regions. The five He i emission lines λ3889,
λ4471, λ5876, λ6678, and
λ7065 are used for the χ2
minimisation and the determination of Y. Large blue and green
filled circles are for the HeBCD and VLT samples, small red filled circles are SDSS
galaxies. We chose to let Te(He+) vary freely
in the range 0.95−1.05 of the  (He+)
value. The continuous line represents the linear regression (whose equation is given
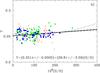
at the bottom of the panel). b) Same as a), but only H
ii regions with EW(Hβ) ≥ 100 Å are
shown, with the excitation parameter x = O2+/O ≥ 0.7 and
with 1σ error in Y ≤ 3%. The dotted line is the
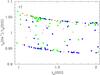
quadratic maximum-likelihood fit to the data. c) Distribution of the
best derived values
Te(He+)/Te(O
iii) versus Te(O iii) for the case
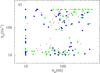
shown in b). d) Distribution of the best derived values
Ne(He+) versus
Ne(S ii) for the case shown in
b).
(He+)
value. The continuous line represents the linear regression (whose equation is given
at the bottom of the panel). b) Same as a), but only H
ii regions with EW(Hβ) ≥ 100 Å are
shown, with the excitation parameter x = O2+/O ≥ 0.7 and
with 1σ error in Y ≤ 3%. The dotted line is the
quadratic maximum-likelihood fit to the data. c) Distribution of the
best derived values
Te(He+)/Te(O
iii) versus Te(O iii) for the case
shown in b). d) Distribution of the best derived values
Ne(He+) versus
Ne(S ii) for the case shown in
b).
Current usage metrics show cumulative count of Article Views (full-text article views including HTML views, PDF and ePub downloads, according to the available data) and Abstracts Views on Vision4Press platform.
Data correspond to usage on the plateform after 2015. The current usage metrics is available 48-96 hours after online publication and is updated daily on week days.
Initial download of the metrics may take a while.