Fig. 6
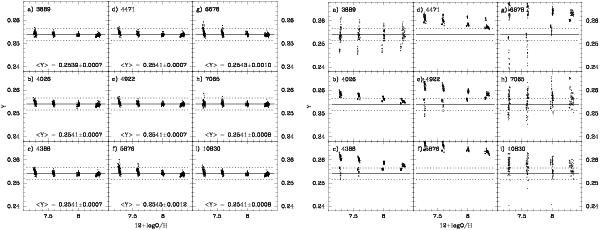
Left: distribution with the oxygen abundance of the empirical
Y values calculated from the case B intensities for
individual He i emission lines. The best values of Ys
in every model are derived by varying
Te(He+) in the range
 (He+).
The definition of solid and dotted lines, and ⟨ Y ⟩ is the same
as in Fig. 5. The mean value of
Y is indicated at the bottom of each plot.
Right: the same as in the left panel, but
empirical Y values are calculated from the intensities for
individual He i emission lines with all processes included.
(He+).
The definition of solid and dotted lines, and ⟨ Y ⟩ is the same
as in Fig. 5. The mean value of
Y is indicated at the bottom of each plot.
Right: the same as in the left panel, but
empirical Y values are calculated from the intensities for
individual He i emission lines with all processes included.
Current usage metrics show cumulative count of Article Views (full-text article views including HTML views, PDF and ePub downloads, according to the available data) and Abstracts Views on Vision4Press platform.
Data correspond to usage on the plateform after 2015. The current usage metrics is available 48-96 hours after online publication and is updated daily on week days.
Initial download of the metrics may take a while.