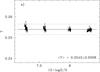
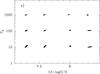
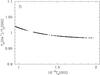
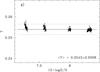
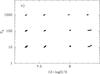
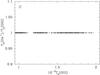
Fig. 5

Distribution with the oxygen abundance of the empirically derived weighted mean
Ya) and Neb)
values calculated with the Porter et al.
(2013) He i emissivities. Nine He i λ3889,
λ4026, λ4388, λ4471,
λ4922, λ5876, λ6678,
λ7065, and λ10830 emission lines are used for
χ2 minimisation and determination of Y.
In the lower parts of the panels showing Y as a function of O/H we
indicate the mean of all Y values derived from the models, together
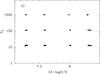
with the dispersion. Top: the electron temperature
Te(He+) is randomly varied in the range
 (He+)
where
(He+)
where  (He+)
is defined by Eq. (32), and the best
derived values of Te(He+) for every model are
shown in c). The solid line in a) shows the input CLOUDY
Y value of 0.254, the dotted lines are 1% deviations, and
⟨ Y ⟩ is the average value of Ys shown by filled
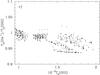
circles. Middle: the same as in the top panel, but
Te(He+) =
(He+).
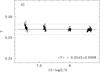
Bottom: the same as in the top panel, but
Te(He+) = Te(O
iii).
(He+)
is defined by Eq. (32), and the best
derived values of Te(He+) for every model are
shown in c). The solid line in a) shows the input CLOUDY
Y value of 0.254, the dotted lines are 1% deviations, and
⟨ Y ⟩ is the average value of Ys shown by filled
circles. Middle: the same as in the top panel, but
Te(He+) =
(He+).
Bottom: the same as in the top panel, but
Te(He+) = Te(O
iii).
Current usage metrics show cumulative count of Article Views (full-text article views including HTML views, PDF and ePub downloads, according to the available data) and Abstracts Views on Vision4Press platform.
Data correspond to usage on the plateform after 2015. The current usage metrics is available 48-96 hours after online publication and is updated daily on week days.
Initial download of the metrics may take a while.