Fig. 9
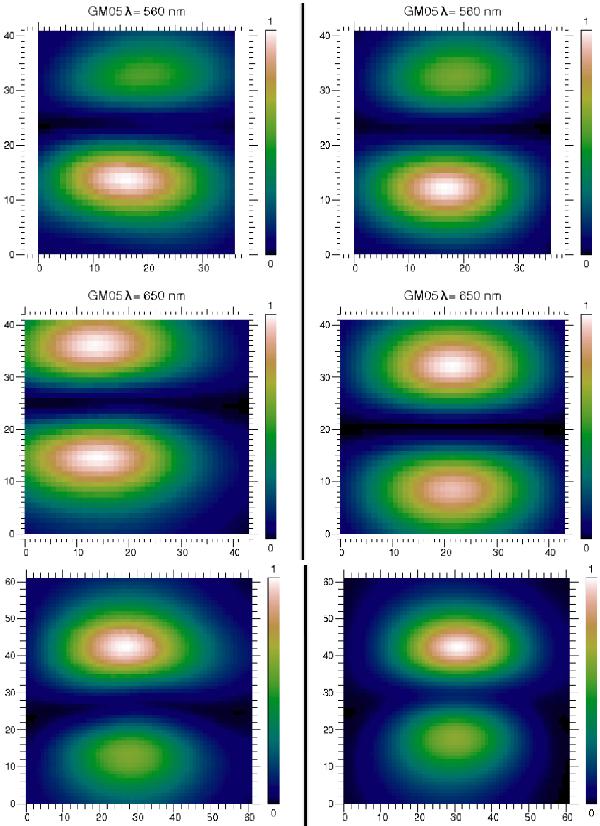
Upper right: simulated image at λ = 560 nm of the nulled PSF, which considers the measured phase unaccuracy on the transmissive chessboard. Upper left: the measured PSF obtained by scanning the SMFO. One pixel corresponds to one step of displacement of the SMFO of 200 nm. Middle panel: same as upper panel but at the wavelength of 650 nm. Lower panel: same as upper panel but in a broad wavelength range of about 450–840 nm.
Current usage metrics show cumulative count of Article Views (full-text article views including HTML views, PDF and ePub downloads, according to the available data) and Abstracts Views on Vision4Press platform.
Data correspond to usage on the plateform after 2015. The current usage metrics is available 48-96 hours after online publication and is updated daily on week days.
Initial download of the metrics may take a while.