Fig. 7
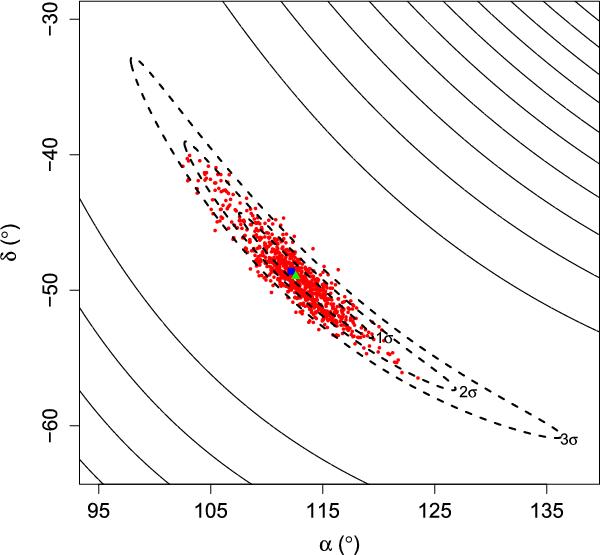
Realizations of CP coordinates for 1000 Monte Carlo simulations (red dots) overlaid on the X2 contours (solid lines) for the CP solution derived in Sect. 5.3. The blue square denotes the CP coordinates for the Lupus moving group derived in that section, and the green triangle denotes the centroid distribution of simulated CPs (see Sect. 5.4). The dashed lines indicate the 1σ, 2σ, and 3σ contour levels of our CP solution.
Current usage metrics show cumulative count of Article Views (full-text article views including HTML views, PDF and ePub downloads, according to the available data) and Abstracts Views on Vision4Press platform.
Data correspond to usage on the plateform after 2015. The current usage metrics is available 48-96 hours after online publication and is updated daily on week days.
Initial download of the metrics may take a while.