Fig. 2
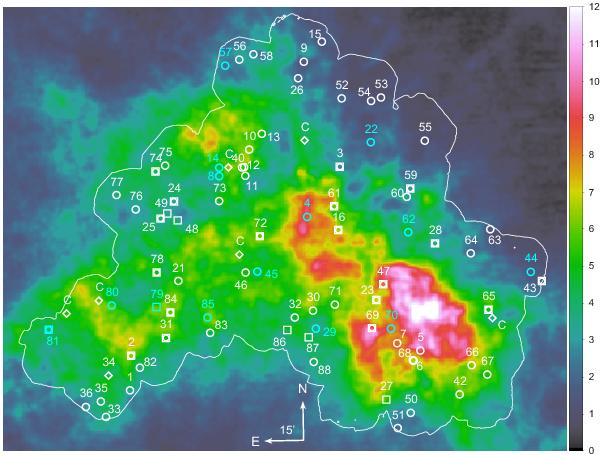
Spatial distribution of the X-ray sources with radio associations in the main field overplotted on the H i map of Stanimirovic et al. (1999). The colour scale indicates the column density in units of 1021 cm-2. The white line marks the XMM-Newton main field of the SMC survey. Seven additional sources are located in outer fields, not shown here. Labels give the source number (Col. 1 in Table 2). Radio sources in X-ray clusters of galaxies (Table 3) are labelled with C. X-ray radio correlations are shown by circles. If the source shows a jet-like structure in radio, it is shown by a boxed circle. Sources that are classified as galaxies are shown by boxes. Sources that are within ClGs are marked with diamonds. Radio sources with −0.3 < α < 0 are plotted in cyan, others in white.
Current usage metrics show cumulative count of Article Views (full-text article views including HTML views, PDF and ePub downloads, according to the available data) and Abstracts Views on Vision4Press platform.
Data correspond to usage on the plateform after 2015. The current usage metrics is available 48-96 hours after online publication and is updated daily on week days.
Initial download of the metrics may take a while.