Fig. 6
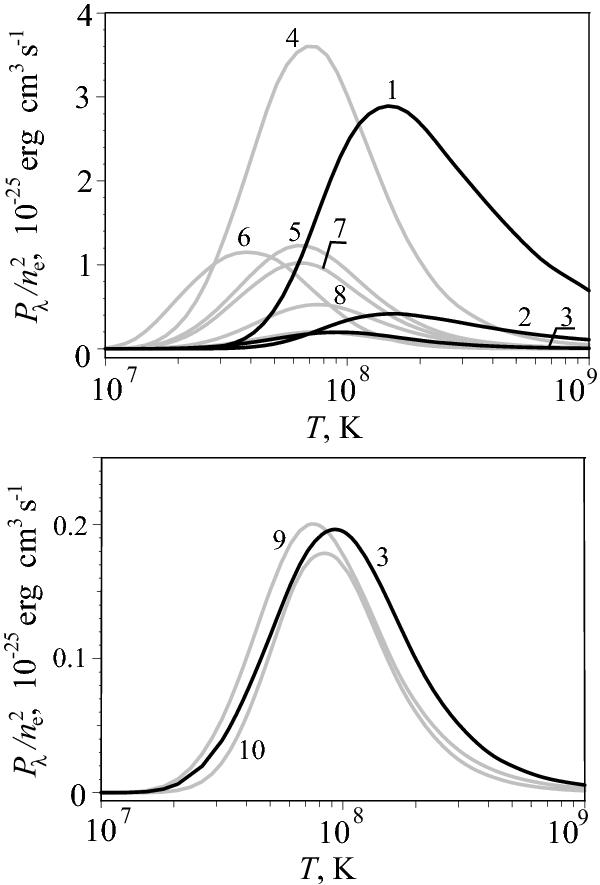
Relative line power as a function of temperature, drawn using the table by Mewe et al. 1985. The numbers near the curves denote the spectral lines according to Table 2. The black curves correspond to the super-hot spectral lines with Tpeak ≥ 108 K and the grey curves to the lower-temperature ones with Tpeak < 108 K. The weakest lines 3, 9, and 10 are also shown separately on the bottom panel.
Current usage metrics show cumulative count of Article Views (full-text article views including HTML views, PDF and ePub downloads, according to the available data) and Abstracts Views on Vision4Press platform.
Data correspond to usage on the plateform after 2015. The current usage metrics is available 48-96 hours after online publication and is updated daily on week days.
Initial download of the metrics may take a while.