Fig. 10
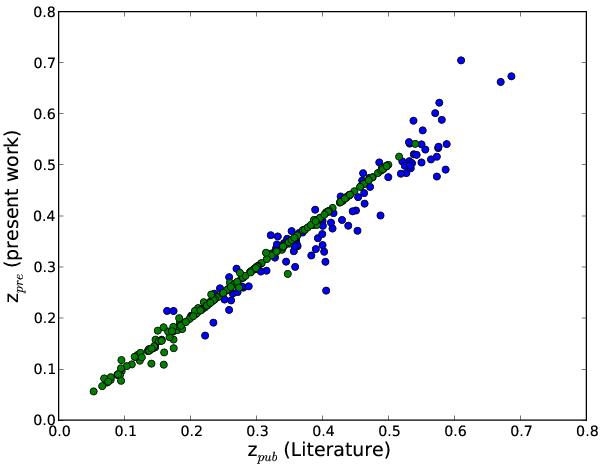
Comparison between the estimated redshifts, zpre, and the published ones, zpub, of the optically confirmed cluster sample. The green dots represent the clusters with spectroscopic redshifts, while blue dots represent the clusters with photometric redshifts only.
Current usage metrics show cumulative count of Article Views (full-text article views including HTML views, PDF and ePub downloads, according to the available data) and Abstracts Views on Vision4Press platform.
Data correspond to usage on the plateform after 2015. The current usage metrics is available 48-96 hours after online publication and is updated daily on week days.
Initial download of the metrics may take a while.