Fig. 13
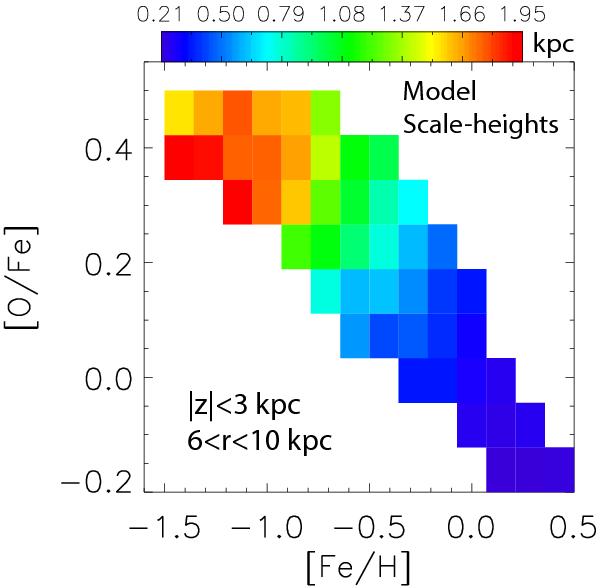
Model vertical scale-heights for different mono-abundance subpopulations as a function of position in the [Fe/H]–[O/Fe] plane. Very good fits are obtained by using single exponentials, excluding the 200 pc closest to the disk plane. A radial range of 6 < r < 10 kpc similar to the SEGUE data is used. This figure can be directly compared with Fig. 4 by Bovy et al. (2012b). Our model predicts scale-heights of up to ~1.9 kpc for the oldest, most metal-poor samples; this should be compared to a maximum of ~1 kpc inferred from the Bovy et al. mass-corrected SEGUE G-dwarf data.
Current usage metrics show cumulative count of Article Views (full-text article views including HTML views, PDF and ePub downloads, according to the available data) and Abstracts Views on Vision4Press platform.
Data correspond to usage on the plateform after 2015. The current usage metrics is available 48-96 hours after online publication and is updated daily on week days.
Initial download of the metrics may take a while.