Fig. 11
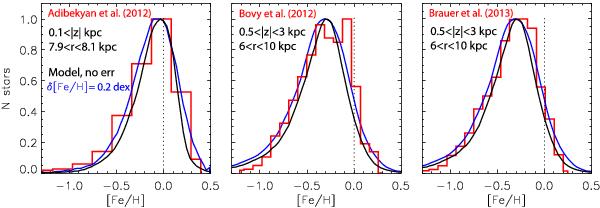
Comparison of our model metallicity distribution function (MDF) with recent observations. The red histograms shows data from Adibekyan et al. (2012) (left), Bovy et al. (2012a) (middle), and Brauer et al. (2013) (right). In each panel the black and blue curves plot the model data with no error in [Fe/H] and convolved error of δ[Fe/H] = 0.2 dex, respectively. We have selected a very local sample to compare with the high-resolution nearby sample by Adibekyan et al. (2012) (as indicated) and a range in z and r to approximately match the SEGUE data studied by the other two works. A shift in the peak from [Fe/H] ~ 0 to [Fe/H] ~ − 0.3 dex for both observed and simulated data is seen when considering a higher sample depth.
Current usage metrics show cumulative count of Article Views (full-text article views including HTML views, PDF and ePub downloads, according to the available data) and Abstracts Views on Vision4Press platform.
Data correspond to usage on the plateform after 2015. The current usage metrics is available 48-96 hours after online publication and is updated daily on week days.
Initial download of the metrics may take a while.