Fig. 1
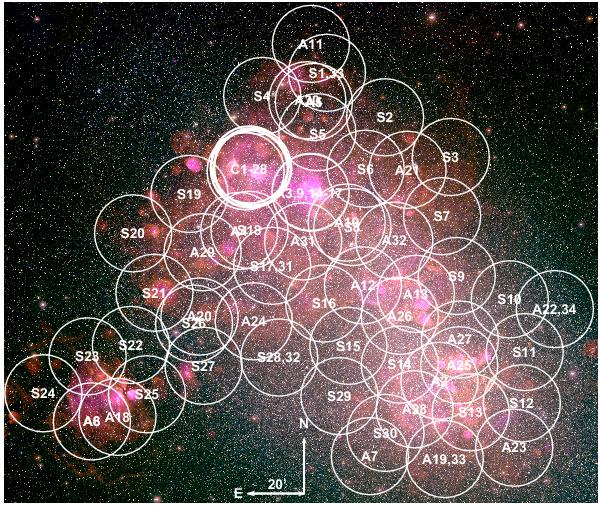
Colour image of the SMC from MCELS (e.g. Smith et al. 2000; Winkler et al. 2005) with Hα/[S ii]/[O iii] in red, green, and blue. The overlaid circles indicate the distribution of XMM-Newton observations and have radii of 800′′. Labels correspond to Col. 1 of Table B.1.
Current usage metrics show cumulative count of Article Views (full-text article views including HTML views, PDF and ePub downloads, according to the available data) and Abstracts Views on Vision4Press platform.
Data correspond to usage on the plateform after 2015. The current usage metrics is available 48-96 hours after online publication and is updated daily on week days.
Initial download of the metrics may take a while.