Fig. 2
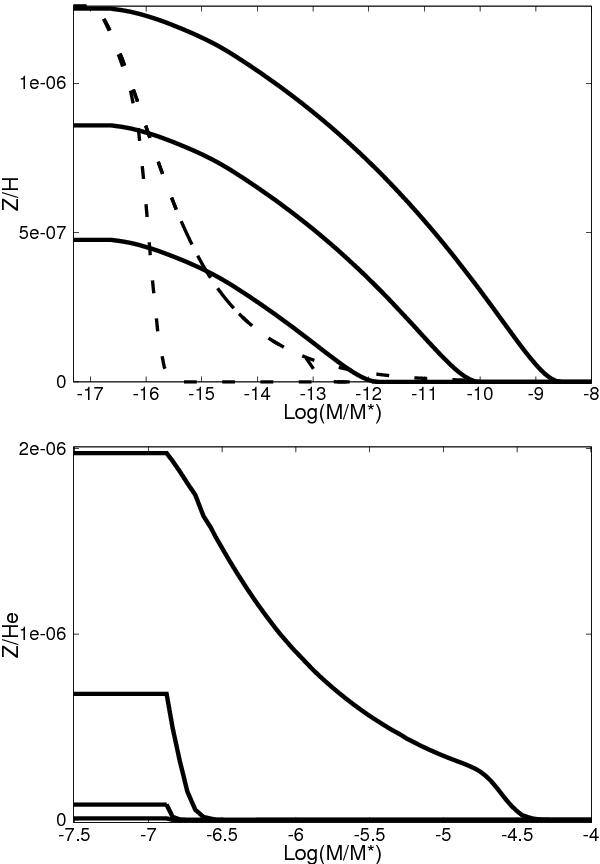
Time evolution of the surface metal abundance profiles by number of hydrogen (or helium) according to the depth in the star for the DA model 3 (top panel) and the DB model 5 (bottom panel) for accretion rates listed Table 2. From bottom to top there are chronological times (t = 106 s, t = 108 s, and t = 5 × 10⁹ s for the DA model, and t = 108 s, t = 109 s, t = 1010 s, and t = 1012 s for the DB model). The dashed lines represent the behaviour with only gravitational settling taken into account, and the solid lines represent the behaviour with both fingering convection and gravitational settling. For the DB model profiles are identical because fingering convection does not develop.
Current usage metrics show cumulative count of Article Views (full-text article views including HTML views, PDF and ePub downloads, according to the available data) and Abstracts Views on Vision4Press platform.
Data correspond to usage on the plateform after 2015. The current usage metrics is available 48-96 hours after online publication and is updated daily on week days.
Initial download of the metrics may take a while.