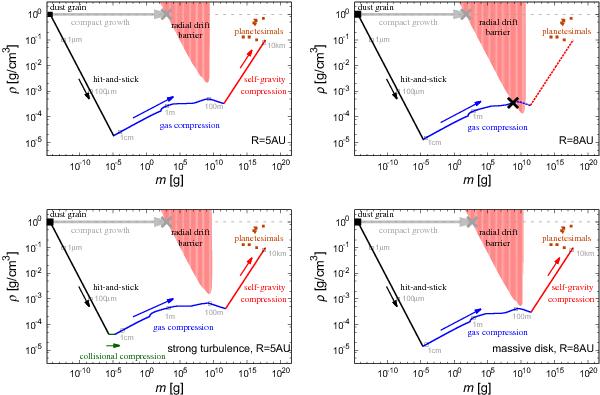
Fig. 3

Pathways in the planetesimal formation in the minimum mass solar nebula model. The gray line shows the constant density evolutional track, which corresponds to the compact growth. The black, green, blue, and red lines are the evolutional track through dust coagulation via fluffy aggregates. Each line represents different mechanisms of dust coagulation, which are hit-and-stick, collisional compression, gas compression, and self-gravity compression. The red shaded region represents where the radial drift timescale is less than the growth timescale, which is equivalent to radial-drift region. The brown squares indicate the properties of comets, and the triangles represent their upper limit. The radii of dust aggregates for 1 μm, 1 cm, 1 m, 100 m, and 10 km are also written. Top left: for 5 AU in orbital radius. Top right: for 8 AU in orbital radius. The cross point represents where the dust falls onto the central star. Bottom left: for 5 AU in strong turbulence model where αD = 10-2. Bottom right: for 8 AU in two times as massive as MMSN model.
Current usage metrics show cumulative count of Article Views (full-text article views including HTML views, PDF and ePub downloads, according to the available data) and Abstracts Views on Vision4Press platform.
Data correspond to usage on the plateform after 2015. The current usage metrics is available 48-96 hours after online publication and is updated daily on week days.
Initial download of the metrics may take a while.


