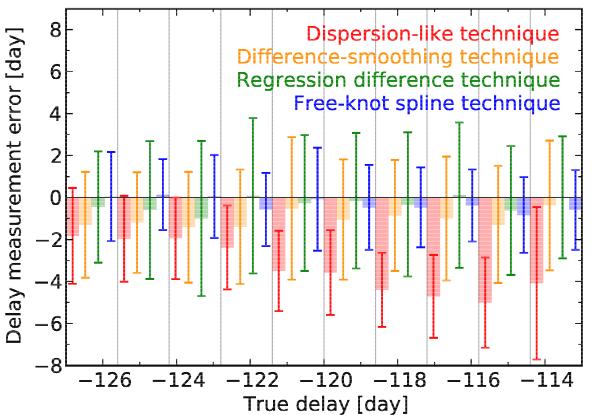
Fig. 6

Error analysis of the four time-delay measurement techniques, based on delay estimations on 1000 synthetic curves that mimic our SDSS J1001+5027 data. The horizontal axis corresponds to the value of the true time delay used in these synthetic light curves. The gray vertical lines delimit bins of true time delay. In each of these bins, the colored rods and 1σ error bars show the systematic biases and random errors, respectively, as committed by the different techniques.
Current usage metrics show cumulative count of Article Views (full-text article views including HTML views, PDF and ePub downloads, according to the available data) and Abstracts Views on Vision4Press platform.
Data correspond to usage on the plateform after 2015. The current usage metrics is available 48-96 hours after online publication and is updated daily on week days.
Initial download of the metrics may take a while.


