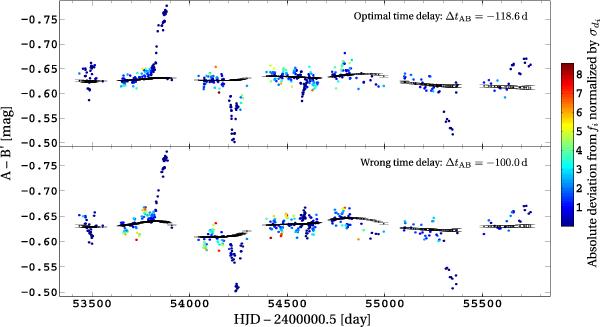
Fig. 5

Difference light curves of SDSS J1001+5027 as obtained by the new difference-smoothing technique introduced in this paper. The curves are shown for the best time-delay estimate found with this technique (top panel, ΔtAB = −118.6 days), and for a wrong time-delay value (bottom panel, ΔtAB = −100.0 days). The difference light curves di are shown as colored points. They are smoothed using a kernel of width s = 100 days to compute the fi (black points). The error bars on the black points show the uncertainty coefficients σfi. The points in the difference light curve di are color-coded according to the absolute factors of their uncertainties σdi by which they deviate from fi. In both panels, light curve A is used as reference, and light curve B is shifted in flux by the same amount.
Current usage metrics show cumulative count of Article Views (full-text article views including HTML views, PDF and ePub downloads, according to the available data) and Abstracts Views on Vision4Press platform.
Data correspond to usage on the plateform after 2015. The current usage metrics is available 48-96 hours after online publication and is updated daily on week days.
Initial download of the metrics may take a while.


