Fig. D.2
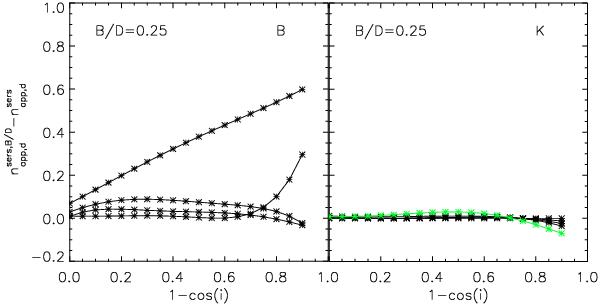
Dust effects corrB/D on the derived Sérsic index of decomposed disks, for B/D = 0.25. The solid lines are polynomial fits to the measurements. The plots represent the difference between the derived Sérsic index of decomposed and single disks,  and
and  , respectively, as a function of inclination (1 − cos(i)), for the B and K optical bands. Two variable Sérsic index functions were used for image decomposition. The curves are plotted for
  (black), 2.0 (green) and 4.0 (red).
Current usage metrics show cumulative count of Article Views (full-text article views including HTML views, PDF and ePub downloads, according to the available data) and Abstracts Views on Vision4Press platform.
Data correspond to usage on the plateform after 2015. The current usage metrics is available 48-96 hours after online publication and is updated daily on week days.
Initial download of the metrics may take a while.