Fig. 4
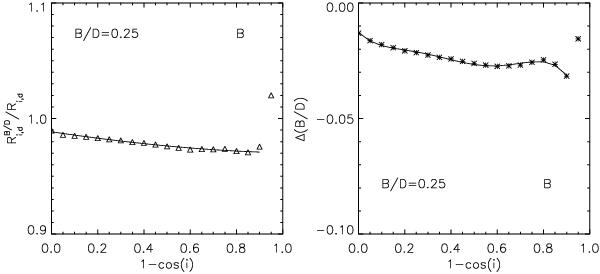
Left: projection effects corrproj, B/D on the derived scale-length of decomposed disks for B/D = 0.25. The symbols represent the measurements while the solid lines are polynomial fits to the measurements. The plots represent the ratio between the intrinsic scale-lengths of decomposed and single disks,  and Ri, d, respectively, as a function of inclination (1 − cos(i)), for the B-band. An exponential (disk) plus a variable index Sérsic (bulge) distribution were used for image decomposition. Right: as in the left panel, but for the derived bulge-to-disk ratios, B/D. The effects are represented as differences between the intrinsic B/D of decomposed disks and bulges and those of single disks and bulges.
Current usage metrics show cumulative count of Article Views (full-text article views including HTML views, PDF and ePub downloads, according to the available data) and Abstracts Views on Vision4Press platform.
Data correspond to usage on the plateform after 2015. The current usage metrics is available 48-96 hours after online publication and is updated daily on week days.
Initial download of the metrics may take a while.