Fig. 11
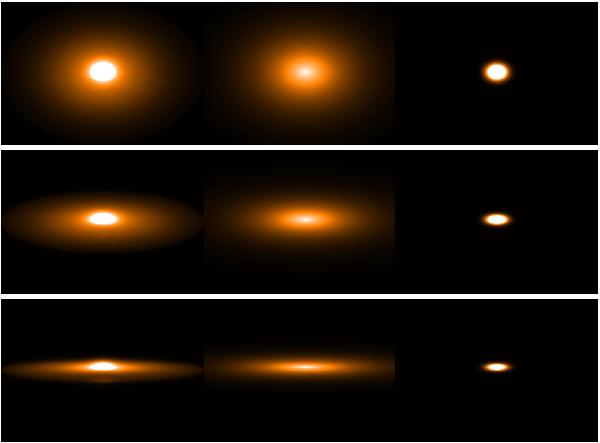
Simulated images of galaxies with exponential bulges and B/D = 0.25 (left column) and corresponding decomposed disks and bulges (middle and right columns). The bulge-disk decomposition fit was made with an exponential plus a variable index Sérsic function, at inclinations 1 − cos(i) = 0.3,0.7,0.9 (i = 46° (first row), 73° (second row) and 84° (third row)), for  .
.
Current usage metrics show cumulative count of Article Views (full-text article views including HTML views, PDF and ePub downloads, according to the available data) and Abstracts Views on Vision4Press platform.
Data correspond to usage on the plateform after 2015. The current usage metrics is available 48-96 hours after online publication and is updated daily on week days.
Initial download of the metrics may take a while.