Fig. 10
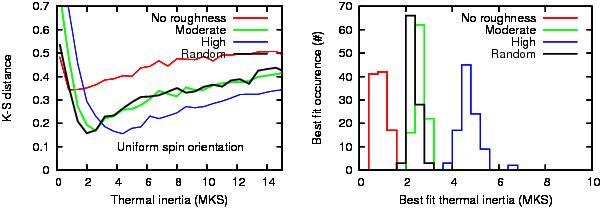
Left: Kolmogorov-Smirnov distance d between the observed distribution of η and those calculated as a function of thermal inertia for the four roughness scenarios. In all cases, a uniform distribution of the polar axes over the sphere is assumed. The minimum of d indicates the best fit thermal inertia Γ0. Right: histograms showing the distribution of best fit Γ0, when accounting for uncertainties in the η measurements (see text).
Current usage metrics show cumulative count of Article Views (full-text article views including HTML views, PDF and ePub downloads, according to the available data) and Abstracts Views on Vision4Press platform.
Data correspond to usage on the plateform after 2015. The current usage metrics is available 48-96 hours after online publication and is updated daily on week days.
Initial download of the metrics may take a while.