Fig. 1
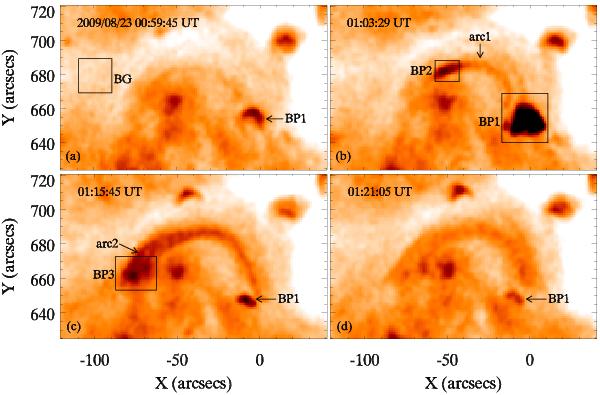
Four snapshots of the SXR images observed by the XRT C_poly filter. BG in panel a) denotes the quiescent background region. BP1 represents the primary CBP. BP2 in panel b) and BP3 in panel c) stand for the sympathetic CBPs induced by BP1. Arc1 in panel b) is the loop connecting BP1 and BP2. Arc2 in panel c) begins to develop in BP3. Note that the color is reversed.
Current usage metrics show cumulative count of Article Views (full-text article views including HTML views, PDF and ePub downloads, according to the available data) and Abstracts Views on Vision4Press platform.
Data correspond to usage on the plateform after 2015. The current usage metrics is available 48-96 hours after online publication and is updated daily on week days.
Initial download of the metrics may take a while.