Fig. 1
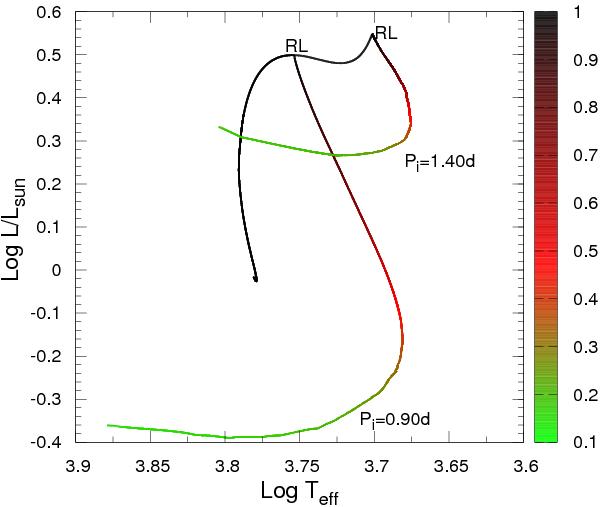
Hertzsprung-Russell diagram for the evolution of the initially 1.0 M⊙ secondary star. The tracks corresponding to initial orbital periods of 0.90 and 1.40d are depicted. The final mass at the end of Roche lobe overflow is, respectively, 0.15540 and 0.18685 M⊙. RL marks the locations in the diagram when the secondary star fills its Roche lobe for the first time and mass loss begins. The color scale to the right shows the stellar mass of the secondary star.
Current usage metrics show cumulative count of Article Views (full-text article views including HTML views, PDF and ePub downloads, according to the available data) and Abstracts Views on Vision4Press platform.
Data correspond to usage on the plateform after 2015. The current usage metrics is available 48-96 hours after online publication and is updated daily on week days.
Initial download of the metrics may take a while.